How our partner turned a small Tier-3 test into a 116.75% ROI in 53 days, and why he trusted his tracker over Meta
Most affiliates chase Tier-1 traffic, where one click can cost dollars, and every mistake hurts. Our partner, Ahmed, went the other way. His question was simple: what happens if the offer pays a flat amount for a simple action, and the click costs less than a cent? If the math works before anyone even touches a creative, the campaign can survive a lot of learning along the way.
He picked Ethiopia on Meta, paired it with a Zeydoo Clickbox offer, and kept the daily budget small enough to lose. Fifty-three days later, the campaign had spent $1,008 and brought back $2,185.
Table of contents
Why Ethiopia and Zeydoo Clickbox?
The reason is simple math. Look:
- Meta estimated a broad audience of 9.6 to 11.3 million people in Ethiopia, and reaching a thousand of them cost about $0.48. That is cheap attention by any standard.
- The offer, Zeydoo #24339*, is a playable Clickbox with a simple registration flow built for Facebook traffic. There is no card step and no long form: the user taps through a short interactive page, and that is the conversion. The payout averages about $0.20 per conversion.
So Ethiopia gave him cheap clicks, and the Clickbox offer gave him easy conversions.
This worked: out of every 100 clicks, about 6 or 7 converted. That brought in around $1.31, while those 100 clicks cost only $0.60. Even if clicks had cost twice as much, he still wouldn’t have lost money.
*#24339 is a private version of Clickbox with an improved flow. We keep it for partners who already run paid Meta traffic with us and have good results on other Zeydoo offers. So if the ID doesn’t come up in search, don’t worry; it’s there. It just isn’t public. If you run Meta traffic and want to try it, ask your manager.
The Setup
- GEO: Ethiopia (Tier 3)
- Traffic source: Meta Ads, leads campaign
- Period: September 1 to October 23, 2026 (53 days)
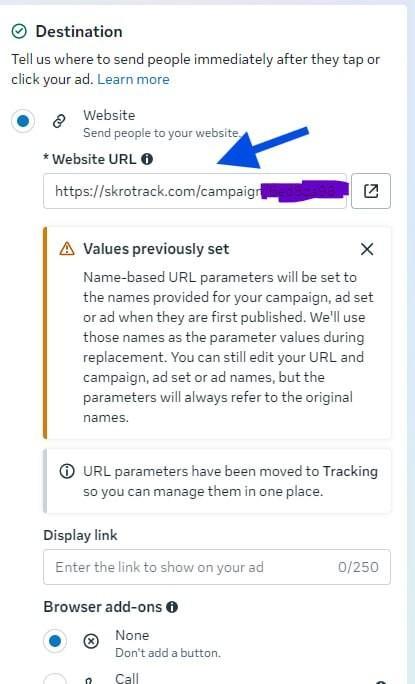
- Tracker: Skro, with S2S postback to Zeydoo
- Offer: Zeydoo Clickbox #24339 (Playable)
The Meta ad settings were kept plain on purpose:
- Conversion location: Website
- Performance goal: Maximize number of leads
- Conversion event: Lead
- Attribution model: Standard
- Audience: broad, with no interest stacking
- Advantage+ leads campaign: off
The idea was to let Meta’s delivery find the people who convert, instead of guessing at interests in a market where the audience is huge and the clicks are cheap.
Three Systems, Same Story
Anyone can screenshot a good day, but Ahmed showed three independent tracking systems compared over the same period, and they all line up with minor discrepancies.
| Metric | Meta Ads Manager | Skro tracker | Zeydoo statistics |
|---|---|---|---|
| Conversions / leads | 7,653 | 10,997 | 11,080 |
| Revenue | n/a | $2,185.06 | $2,214.77 |
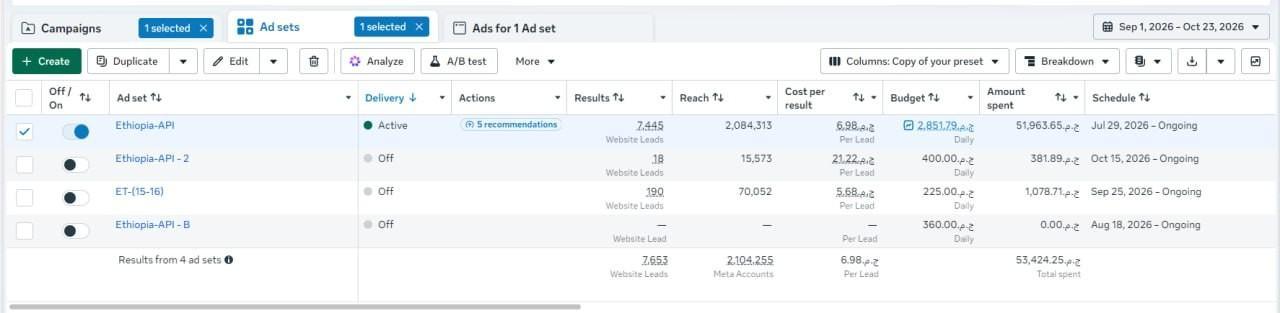
| Spend | 53,424.25 EGP | $1,008.10 | n/a |
The Meta ad account is billed in Egyptian pounds, so Ads Manager shows spend in EGP. In dollars, it is the same $1,008.10 that Skro shows.
Skro and Zeydoo agree to within 0.75% on conversions and 1.4% on revenue. Meta, on the other hand, saw only 7,653 leads, because it counts only the events its pixel can see. The S2S postback caught the rest.

Ahmed
That gap matters. S2S postbacks showed 10,997 conversions while Meta saw 7,653. Decisions were made on the larger, more accurate number. Skro and Zeydoo differ by only 0.75% on conversions, but Skro also pulls in the Meta spend. Zeydoo is not a tracker, so it never sees ad costs. With conversions and spend in one place (that’s where the cost columns in the table above come from), Skro became the source of truth for every optimization decision.
What the Data Showed
Bigger budgets cost more per lead
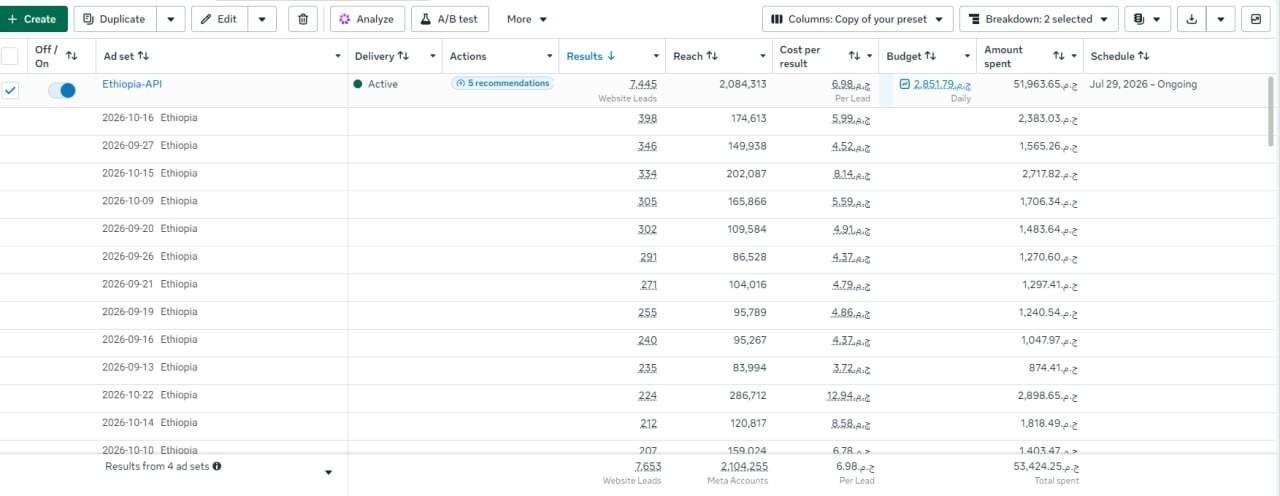
Meta’s daily breakdown shows a clear pattern. The more Ahmed spent in a day, the more each lead cost. On cheaper days, a lead cost about $0.09 (4.83 EGP). On the most expensive days, it was closer to $0.17 (8.91 EGP), almost twice as much.
Only one day went over the $0.20 (10.6 EGP) payout, at $0.24 (12.94 EGP) per lead, and only by Meta’s count. Skro tracked more conversions than Meta, so even that day didn’t lose money.
One bad day does not mean a bad campaign
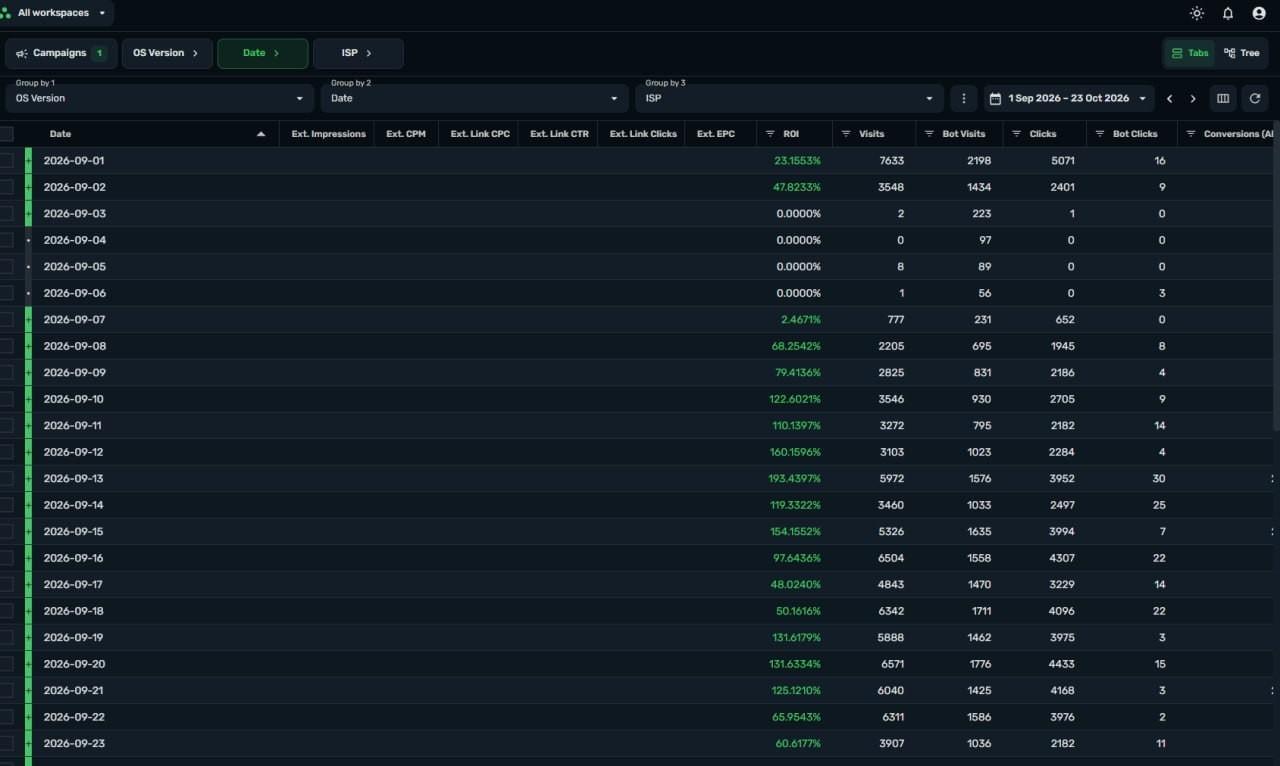
Between September 27 and October 19, 21 of 23 days were profitable. October 1 lost money (minus 54.66% on just 474 visits), but about a week later the campaign posted its best run: +310%, +388% and +903% ROI from October 9 to 11. The other weak day, October 18, was nearly empty with 7 visits.
Ahmed
The campaign did not need perfect days; it needed a positive average, which is why decisions were made on multi-day windows. Do not kill a campaign over one red day. Review 3- to 7-day ROI, not daily ROI.
One operator carried the campaign
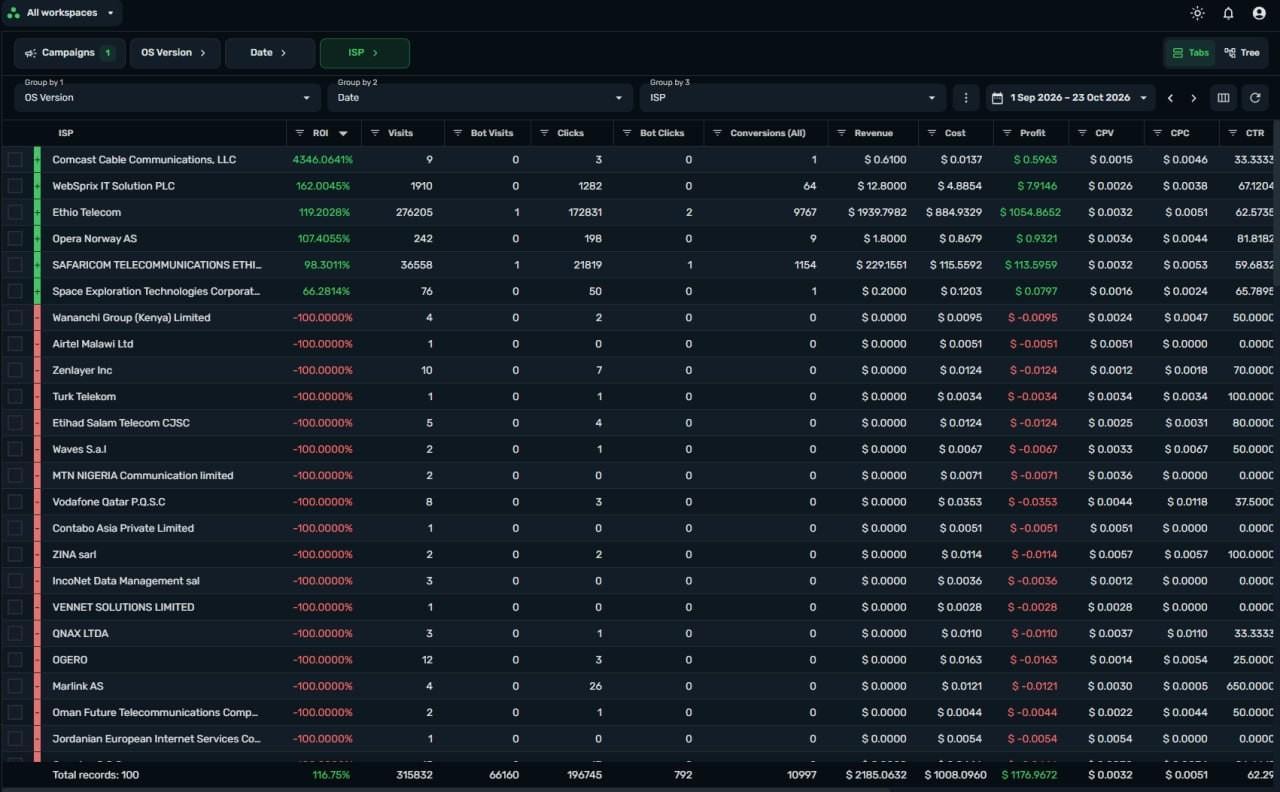
| ISP | Conversions | Share | ROI | Profit |
|---|---|---|---|---|
| Ethio Telecom | 9,767 | 88.8% | +119.2% | $1,054.87 |
| Safaricom Ethiopia | 1,154 | 10.5% | +98.3% | $113.60 |
Ethio Telecom produced almost nine out of ten conversions and most of the profit. Dozens of other ISPs sent a handful of visits each and converted nothing, which is exactly the kind of noise worth blacklisting once the sample is big enough.
Newer OS versions paid more
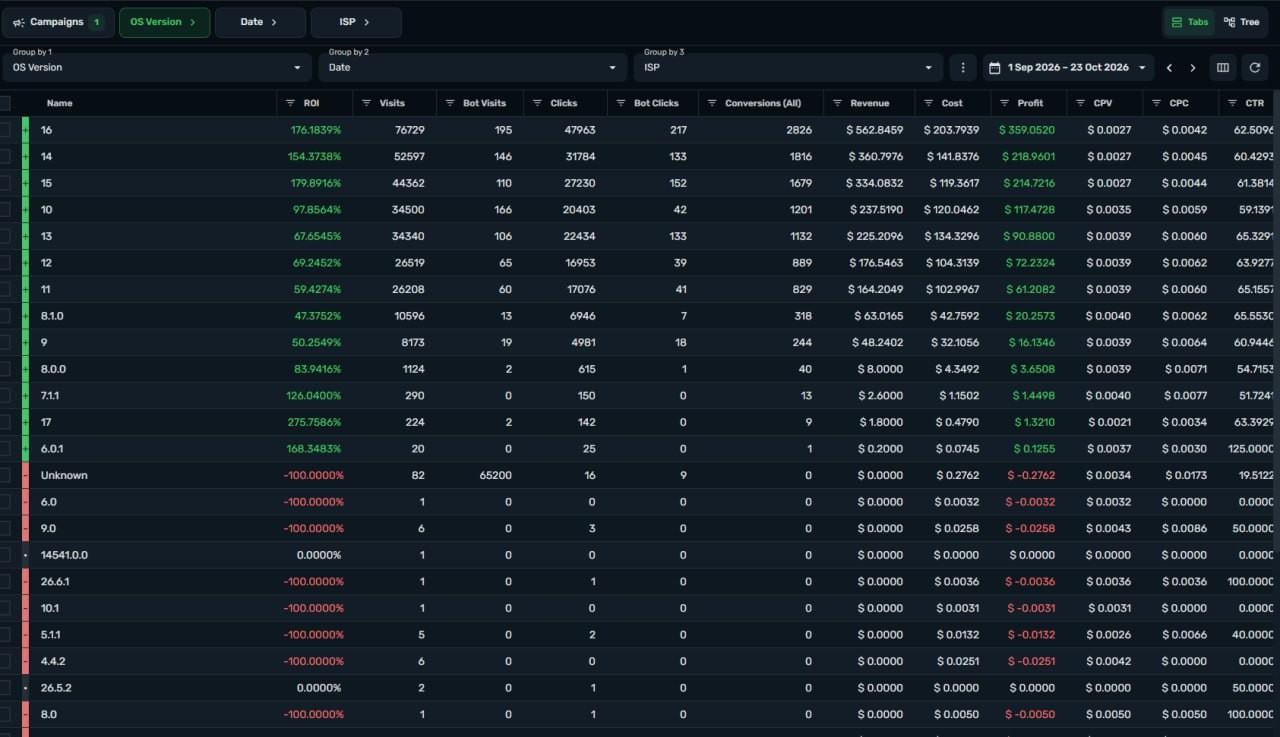
Grouping by OS version in Skro shows another split. The three newest versions (16, 15 and 14) brought 57% of all conversions and 67% of the profit, at a combined ROI of about 170%. Versions 10 to 13 were still profitable, but at roughly 74% ROI.
The same report also shows what the tracker filtered out. A single “Unknown” OS segment logged 65,200 bot visits, and they cost the campaign just $0.28.
To Sum Up: How to Run This Setup Yourself
Ahmed wrapped up his own write-up of the campaign with a section he called “Your Turn: The Replicable Playbook.” In his words, these are the rules anyone can try on their own GEO and offer:
Multiply the payout by the click-to-conversion rate to get your break-even cost per click. Launch only if your expected CPC is about half of that or less.
Start around five offers at about $5 a day each, and check that tracker and network conversions agree within a few percent before going further.
Group traffic by OS version and ISP in your tracker. Once a segment has enough data, cut the losers and keep the winners.
Raise budgets on winners by about 20% every 48 hours. If the cost per lead climbs above roughly 1.5 times your baseline, hold for 48 hours before the next step.
- Payout × CR is at least twice your expected CPC
- The tracker link sits in the Website URL field
- The S2S postback is tested with a real conversion
- Broad audience, Lead event, Website as conversion location
- A daily budget small enough to lose
The recipe was simple: cheap clicks, an easy offer, and a tracker that counted every conversion. As Ahmed puts it, “Simplicity and accurate tracking, not secret targeting, were the pillars of this result.”
This case reflects the results of a single campaign by one media buyer on one GEO and one offer over a 53-day period. It is not a rate card, forecast, promise, or guarantee of earnings. Payouts and traffic costs change over time, and individual results vary depending on GEO, traffic source, creatives, offer demand, and execution.